All Ford Mustang, Chevy Camaro, Corvette, hot rods or roadster, stock engine parts or performance parts, create high or low pressure in the cylinders. If you had the ability to measure the pressure in the cylinder during all four of the engine's strokes you could quickly identify problems and know what engine parts to change and improve your engine's performance.
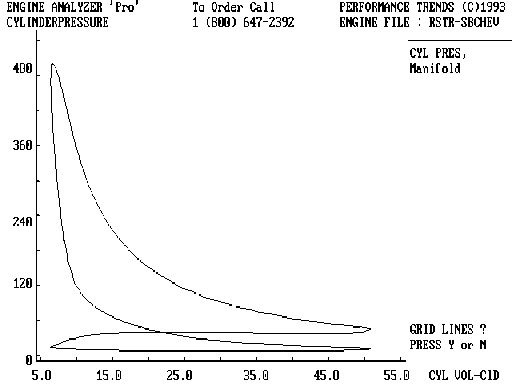
This is the idea behind pressure-volume diagrams, also known as P-V diagrams. The graph below is an example of a P-V diagram. The numbers on the vertical scale represent the pressure in the cylinder. The numbers across the bottom scale represent the "swept" volume of the cylinder.

When the piston is at bottom dead center, the cylinder will have its largest volume. As the piston moves up the cylinder, the volume is reduced. At top dead center the cylinder is at its minimum volume.
In this diagram you can see the line reaches a peak value of approximately 480 on the vertical scale. This would represent the pressure in the cylinder at TDC (during combustion). Following the trace of the cylinder pressure you can analyze problems and try change engine parts in a software program in order to improve the power output from the engine.
For example, as the piston moves down the cylinder during the power stroke, the pressure drops in the cylinder. This stroke is represented on the graph by the upper line that is swinging down and to the right from the peak pressure. Any changes that would result in a higher peak pressure and raise this segment of the line on the graph would result in more force pushing on the piston during the power stroke. In other words, the higher the pressure on graph during this segment the more power the engine can generate. (Performance parts on most any Mustang, Camaro, Corvette, or hot rod can create much more pressure than shown in this example of a stock engine.)
However, if the exhaust valve opens too late, a fair amount of pressure will be left in the cylinder. In this case, when the piston moves up the cylinder, it has to push against that pressure during the exhaust stroke, using some of the power from the previous stroke. The pressure in the exhaust stroke is indicated by the level of the line as it moves to the left from where the line was at the end of the power stroke. So, the goal on this stroke is to open the exhaust valve at just the right time to make this segment of the line as low as possible. (Again, performance parts on most any Mustang, Camaro, Corvette, or hot rod can create less pressure than shown in this example of a stock engine.)
Once the piston reaches TDC on the exhaust stroke, it starts back down the cylinder for the intake stroke. If the intake manifold is restrictive (or you have a small carb), the pressure in the cylinder will drop (more vacuum) as the piston moves down the cylinder during the intake stroke. This is represented by the line being at an even lower level as it moves back to the right during the intake stroke. This is not good. Basically, the lower the line, the lower the engine's performance.
Lastly in the engine's cycles, the piston now moves back up the cylinder on the compression stroke. This is represented on the diagram by the line swinging up the graph as the line moves back to the left. Near the end of the compression stroke, the ignition starts the combustion, at this point the line turns sharply and heads up to the peak pressure again.
With the P-V Diagram you can quickly see the impact from early or late ignition timing on the peak cylinder pressure. Also, you can see the influences of intake duration, exhaust duration, intake manifold and exhaust system.
This valuable tool (P-V Diagram) previously used by only a few is now available in the Engine Analyzer Pro software.